

Image Details
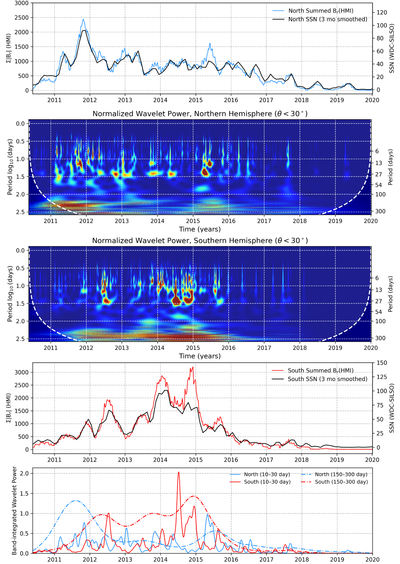
Caption: Figure 1.
Monthly hemispheric sunspot number (SSN) and summed HMI Br, boxcar smoothed over 3 months, for the north (top panel) and south (fourth panel) hemispheres. The second and third panels show the corresponding Morlet wavelet power spectra for periods between 1 and 379 days in the north and south hemispheres, respectively. Dark blue (red) indicates low (high) power. Enhanced wavelet power occurs in temporally localized emergence episodes that are largely offset between the two hemispheres. The fifth panel isolates this power in two period ranges—10–30 days (solid) and 150–300 days (dashed–dotted)—for the north (blue) and south (red). In the 150–300 day range, the north shows a single burst of power in 2011, while the south exhibits persistently enhanced power from 2012 through 2015. In the 10–30 day range, both hemispheres show a series of discrete bursts that alternate in time between hemispheres.
Other Images in This Article
Copyright and Terms & Conditions
© 2026. The Author(s). Published by the American Astronomical Society.

