

Image Details
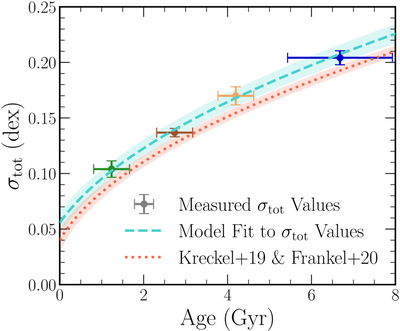
Caption: Figure 4.
The measured values of σtot(τ), with points colored as in Figure 3. Horizontal error bars indicate the standard deviation of the ages in each bin, while vertical error bars indicate the ±1σ range around the best-fit values of σtot. The cyan dashed curve is the best-fit model of the form of Equation (21), while the red dotted curve shows the result of using parameters derived from K. Kreckel et al. (2019) and N. Frankel et al. (2020). The shaded regions indicate the range of model curves obtained by varying the fitted σf and ﹩{\langle {(\delta {R}_{{\rm{g}}})}^{2}\rangle }_{0}﹩ by their respective ±1σ statistical uncertainties.
Other Images in This Article
Copyright and Terms & Conditions
© 2026. The Author(s). Published by the American Astronomical Society.

