

Image Details
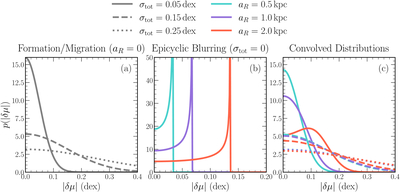
Caption: Figure 1.
Absolute metallicity-residual distributions produced by formation and migration processes (panel (a)), epicyclic blurring (panel (b)), and the combination of both effects (panel (c)). Different colors indicate different epicyclic amplitudes, while different line styles indicate different amounts of scatter from formation and migration. To produce these curves, we have used mR = −0.0678 dex kpc–1 as measured for μ = [Fe/H] by Z. Hackshaw et al. (2024).
Other Images in This Article
Copyright and Terms & Conditions
© 2026. The Author(s). Published by the American Astronomical Society.

Copyright ©
2026 Astronomy Image Explorer. All Rights Reserved.
