

Image Details
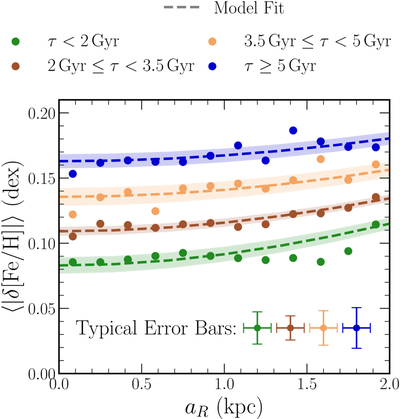
Caption: Figure 3.
The mean absolute residuals in [Fe/H] as a function of aR for stars in different age bins (different colors); median errors on the mean for each age bin are shown at the bottom. The dashed curves show the predictions of Equation (B1) with mR = −0.0678 dex kpc−1 and the best-fit value of σtot for each age bin; the shaded regions indicate the range of model curves obtained by varying the fitted σtot by ﹩\pm 1{\sigma }_{{\sigma }_{{\rm{tot}}}}﹩.
Other Images in This Article
Copyright and Terms & Conditions
© 2026. The Author(s). Published by the American Astronomical Society.

Copyright ©
2026 Astronomy Image Explorer. All Rights Reserved.
