

Image Details
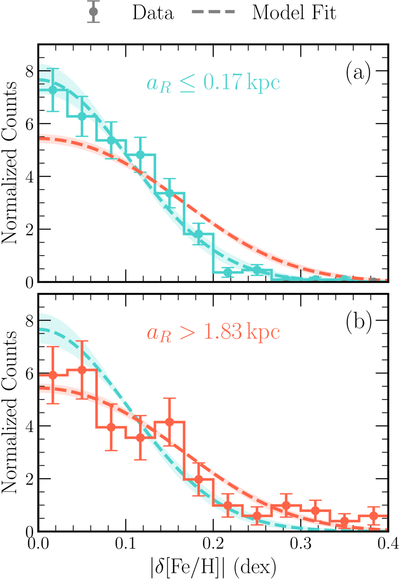
Caption: Figure 2.
Absolute residual histograms (with Poisson error bars) for stars with τ < 2 Gyr in the smallest (panel (a), cyan) and largest (panel (b), red) aR bins. The dashed curves show the model ptot for each value of aR (in corresponding colors), using mR = −0.0678 dex kpc–1 and the fitted σtot value for this age bin. The shaded regions show the range of model distributions obtained by varying the fitted σtot by ﹩\pm 1{\sigma }_{{\sigma }_{{\rm{tot}}}}﹩.
Other Images in This Article
Copyright and Terms & Conditions
© 2026. The Author(s). Published by the American Astronomical Society.

Copyright ©
2026 Astronomy Image Explorer. All Rights Reserved.
