

Image Details
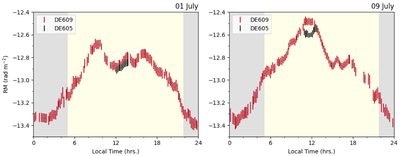
Caption: Figure 3.
The time series of RMs as a function of local time during a day, where the left and right plots correspond to the observation results from July 1 and 9 July, respectively. The red and black points in each plot were observed using the station DE609 and station DE605. The meanings of the gray area, yellow area, and the boundaries between them are consistent with Figure 1.
Other Images in This Article
Copyright and Terms & Conditions
© 2026. The Author(s). Published by the American Astronomical Society.

Copyright ©
2026 Astronomy Image Explorer. All Rights Reserved.
