

Image Details
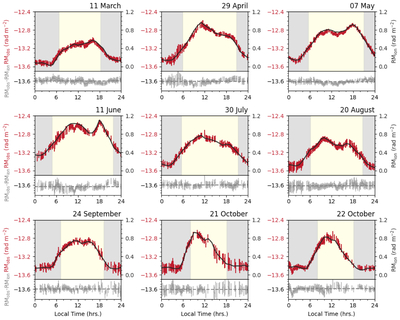
Caption: Figure 1.
The time series of RMs as a function of local time during a day for nine observations made in 2017. For the top panel in each plot, the red points show the RM of PSR J0814+7429 (left axis label, RMobs) and the black line shows the ionospheric RM (right axis label, RMion) along the LoS to this pulsar (as derived by the RMEXTRACT software package, based on the CODE+WMM). In the bottom panel in each plot, the gray points represent the residuals between the RMobs and RMion, and the gray horizontal line is the mean value of these residuals. The observation time is labeled in the upper-right of each plot. From left to right in each plot, the first and second boundaries between the light-gray and yellow shaded regions mark the sunrise and sunset times, respectively. That is, the light-gray shaded region mainly corresponds to nighttime, and the light-yellow shaded region to daytime. The ISM RM is approximately −13.60 rad m−2 (see Section 3.2). Except for the observation on May 7, which was conducted using the DE604 station, the other observations were all conducted using the DE609 station.
(The data used to create this figure are available in the online article.)
(The data used to create this figure are available.)
Other Images in This Article
Copyright and Terms & Conditions
© 2026. The Author(s). Published by the American Astronomical Society.

