

Image Details
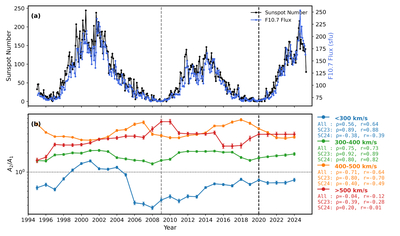
Caption: Figure 2.
Solar cycle evolution of the ratio between the mass-proportional and equal-temperature populations, represented by the fitted double-Gaussian component area ratio A2/A1, for different solar wind speed regimes. Panel (a) shows the monthly averaged sunspot number (black) and F10.7 solar radio flux (blue) as proxies of solar activity. Panel (b) presents the solar cycle variation of A2/A1 for four solar wind speed bins: <300 km s−1 (blue), 300–400 km s−1 (green), 400–500 km s−1 (orange), and > 500 km s−1 (red). Here, A1 corresponds to the area of the Gaussian component centered near Tα/Tp ∼ 1, representing the equal-temperature population, while A2 corresponds to the area of the Gaussian component centered near Tα/Tp ∼ 4, representing the mass-proportional temperature population. Values of A2/A1 > 1 indicate dominance of the mass-proportional population, whereas A2/A1 < 1 indicate dominance of the equal-temperature population. Error bars denote the propagated 1σ uncertainties obtained from the double-Gaussian fitting procedure. The Spearman rank correlation coefficients (ρ) and Pearson correlation coefficients (r) between A2/A1 and solar activity are listed separately for SC23, SC24, and the full interval (“All”) for each speed bin. The horizontal dotted line marks A2/A1 = 1, where the two populations contribute equally. The gray vertical dashed line marks the transition between SC23 and SC24, while the black vertical dashed line marks the transition between SC24 and SC25.
Other Images in This Article
Copyright and Terms & Conditions
© 2026. The Author(s). Published by the American Astronomical Society.

