

Image Details
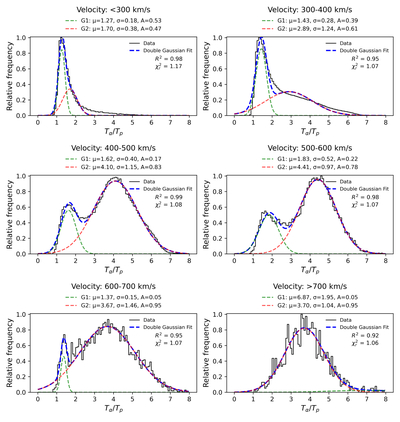
Caption: Figure 1.
Distribution of the alpha-to-proton temperature ratio (Tα/Tp) in different solar wind speed bins, fitted with a double-Gaussian model. Each panel corresponds to the speed range indicated at the top: <300, 300–400, 400–500, 500–600, 600–700, and >700 km s−1. The black step histograms represent the observed relative frequency of Tα/Tp. The blue dashed curves show the total double-Gaussian fit to the data. The individual Gaussian components are overplotted as green dashed lines (G1) and red dashed lines (G2), corresponding respectively to the equal alpha-to-proton temperature ratio population and the mass-proportional temperature ratio population. The fitted parameters mean (μ), standard deviation (σ), and fractional area (A) for both components are listed at the top of each panel. The goodness of fit is quantified by the coefficient of determination (R2) and reduced chi-square (﹩{\chi }_{r}^{2}﹩), also indicated within each panel. At low velocities (<400 km s−1), the Tα/Tp distribution is dominated by an equal alpha-to-proton temperature ratio component, whereas at higher velocities (>400 km s−1), a distinct mass-proportional temperature component emerges with broader distributions and higher Tα/Tp values (∼4), indicative of stronger mass-proportional heating in the fast, weakly collisional solar wind.
Other Images in This Article
Copyright and Terms & Conditions
© 2026. The Author(s). Published by the American Astronomical Society.

