

Image Details
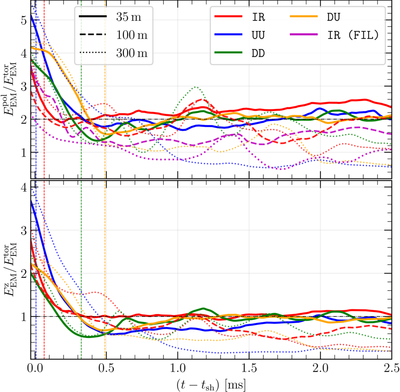
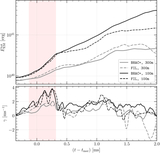
Caption: Figure 4.
Top panel: evolution of the ratio of the EM energy in the poloidal and toroidal components (solid lines) for all binaries considered with 35 m resolution. Note that at late times the ratio converges to a constant value of ≃2. Bottom panel: as in the top, but relative to the ratio between the z and the toroidal components; note that at late times the ratio converges to a constant value of ≃1. Shown with dotted lines are the same quantities when employing a coarser resolution of 300 m, yielding significantly different values. For the IR case only, the red dashed line shows the medium-resolution simulation (100 m) run with BHAC+, while the purple dotted line and dashed line show the FIL simulations with resolutions of 300 m and 100 m, respectively.
Other Images in This Article
Copyright and Terms & Conditions
© 2026. The Author(s). Published by the American Astronomical Society.

