

Image Details
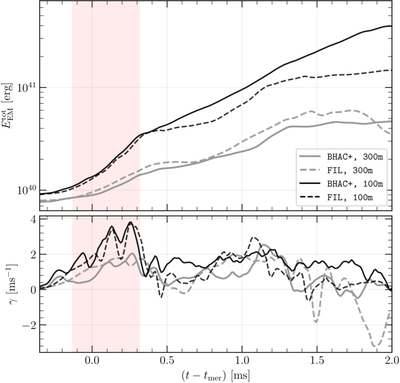
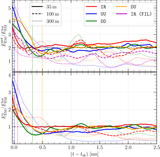
Caption: Figure B2.
Top panel: evolution of the total EM energy from simulations of the IR case using FIL (dashed lines) and BHAC+ (solid lines) with GWRR corrections by employing the resolutions of 300 m (gray) and 100 m (black), respectively. Bottom panel: their corresponding evolutions of the growth rate. The shaded area reflects the KHI phase from tsh to tsh,1/2 for the 100 mBHAC+ simulation.
Other Images in This Article
Copyright and Terms & Conditions
© 2026. The Author(s). Published by the American Astronomical Society.

Copyright ©
2026 Astronomy Image Explorer. All Rights Reserved.
