

Image Details
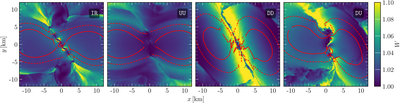
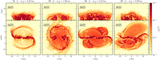
Caption: Figure 3.
Distributions of the Lorentz factor W for all cases considered (different columns) at time t = tmer. As in Figure 2, the distributions are rotated so that the stellar centers are on a y = 0 line. Dashed and solid lines correspond to the rest-mass density contours of 4 × 10¹⁴ and 6 × 10¹⁴ g cm−3, respectively.
Other Images in This Article
Copyright and Terms & Conditions
© 2026. The Author(s). Published by the American Astronomical Society.

Copyright ©
2026 Astronomy Image Explorer. All Rights Reserved.
