

Image Details
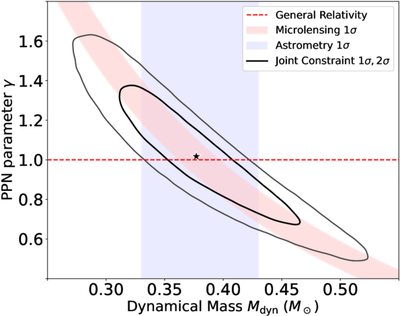
Caption: Figure 3.
Joint posterior distribution of Mdyn and γ. The purple shaded region denotes the 1σ confidence interval for the simulated Mdyn, while the pink shaded region represents the corresponding 1σ interval for ﹩{M}_{{\rm{lens}}}^{{\rm{GR}}}﹩. The solid black contours denote the 1σ and 2σ joint credible regions.
Other Images in This Article
Copyright and Terms & Conditions
© 2026. The Author(s). Published by the American Astronomical Society.

Copyright ©
2026 Astronomy Image Explorer. All Rights Reserved.
