

Image Details
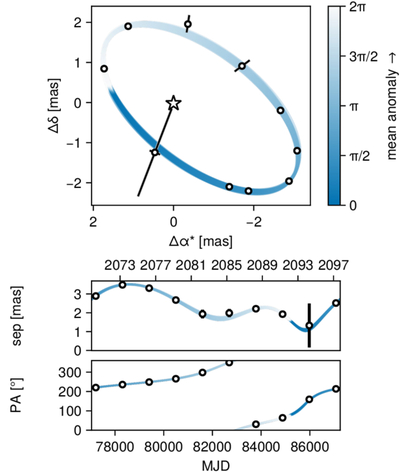
Caption: Figure 2.
The simulated observational baseline starts from the year 2070, at which epoch the background source flux contamination within the instrument’s IFOV becomes negligible. Data points without visible error bars have uncertainties that are smaller than the symbol size on this scale. The blue curve represents the possible orbits, with the color bar on the right indicating the mean anomaly at different phases. To mimic a realistic observing campaign given the expected long orbital period of the binary lens system, data points are sampled at a regular cadence of three years, extending until 2097.
Other Images in This Article
Copyright and Terms & Conditions
© 2026. The Author(s). Published by the American Astronomical Society.

Copyright ©
2026 Astronomy Image Explorer. All Rights Reserved.
