

Image Details
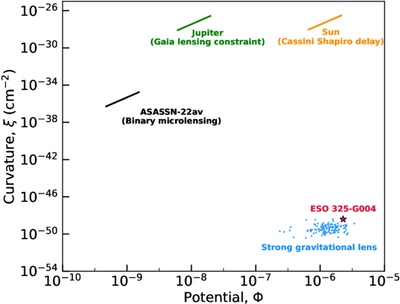
Caption: Figure 1.
Potential–curvature parameter space of various lensing-relevant systems, along with the Cassini mission. The horizontal axis shows the dimensionless Newtonian potential (Φ), and the vertical axis represents the curvature (ξ) derived from the Kretschmann scalar (for the Schwarzschild metric, the Kretschmann scalar is expressed as ﹩\xi ={({R}^{\alpha \beta \gamma \delta }{R}_{\alpha \beta \gamma \delta })}^{1/2}=\sqrt{48}\frac{GM}{{r}^{3}{c}^{2}}﹩, where R represents the Riemann curvature tensor, following T. Baker et al. 2015). The line segments represent the values of Φ and ξ calculated at grazing incidence along the ray-tracing path that contributes 95% of the total deflection angle (since the deflection angle comes from a long path, and different positions along this path have different gravitational environments, we only keep the part that makes the largest contribution to the deflection angle. Specifically, for Jupiter, we calculate the light rays that graze its surface, whereas detecting light deflection using Gaia’s high-precision astrometric data usually requires considering the gravitational fields of the Sun or even Saturn (M. A. C. Perryman et al. 2001)). The black line denotes the microlensing event ASASSN-22av (Z. Wu et al. 2024) adopted in our subsequent simulations, which also serves as a representative example of a typical Galactic M dwarf lens. The blue dots show the distribution of strong-lensing galaxies from S. Cao et al. (2015), while the pentagram marks a precisely modeled galaxy, ESO 325-G004 (T. E. Collett et al. 2018).
Other Images in This Article
Copyright and Terms & Conditions
© 2026. The Author(s). Published by the American Astronomical Society.

