

Image Details
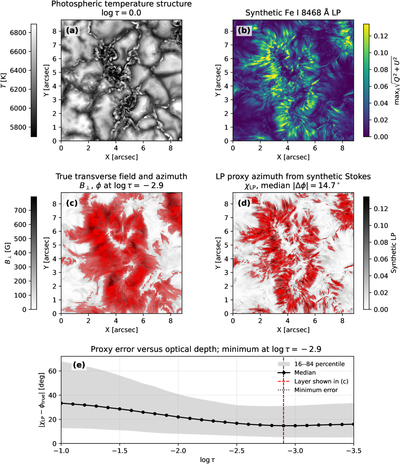
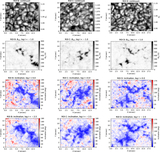
Caption: Figure 3.
Illustrative magnetic structure of a quiet-Sun network element from a MURaM simulation. (a) Temperature at ﹩\mathrm{log}\tau =0﹩, showing a cool, concentrated magnetic core embedded within the granular photosphere. (b) Maximum linear polarization signal, ﹩{{\rm{\max }}}_{\lambda }\sqrt{{Q}^{2}+{U}^{2}}﹩, computed over the synthetic Fe I 8468 Å spectral window. The strongest linear polarization occurs preferentially around the boundary of the magnetic concentration rather than within the central core. (c) Transverse magnetic field strength B⊥ at ﹩\mathrm{log}\tau =-2.9﹩, with red lines indicating the magnetic azimuth directions. (d) Azimuth proxy derived from the synthesized Stokes Q and U profiles using the same methodology applied to the SCIP observations, overlaid on the synthetic linear polarization map. Red lines indicate the inferred azimuth orientation. (e) Median absolute difference between the azimuth proxy, χLP, and the ground-truth magnetic azimuth in the MURaM simulation as a function of optical depth. The shaded region denotes the 16th–84th percentile range. The minimum error occurs near ﹩\mathrm{log}\tau \approx -2.9﹩, indicating that the wavelength-integrated Fe I 8468 Å line is most sensitive to the magnetic azimuth at upper-photospheric heights.
Other Images in This Article
Copyright and Terms & Conditions
© 2026. The Author(s). Published by the American Astronomical Society.

