

Image Details
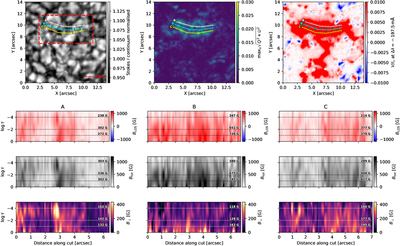
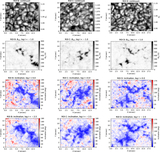
Caption: Figure 1.
Overview of the analyzed network region and corresponding depth-dependent magnetic structure along three selected cuts. Top row: continuum intensity (left), maximum linear polarization signal ﹩{{\rm{\max }}}_{\lambda }\sqrt{{Q}^{2}+{U}^{2}}﹩ (middle), and Stokes V in the Fe I 8468 Å wing (right). Three spatial cuts (A, B, and C) tracing the linear polarization ridge are taken. Lower panels: stratifications along cuts A–C as a function of distance and optical depth ﹩\mathrm{log}\tau ﹩. Rows show LOS magnetic field BLOS, total field strength Btot, and transverse field component B⊥, respectively. The dashed red box highlights the region shown in Figure 2. All Stokes quantities are continuum normalized. The tick marks on the upper panels and vertical lines on the lower panels denote 1″ increments. The median values at given optical depths are indicated on the bottom panels.
Other Images in This Article
Copyright and Terms & Conditions
© 2026. The Author(s). Published by the American Astronomical Society.

