

Image Details
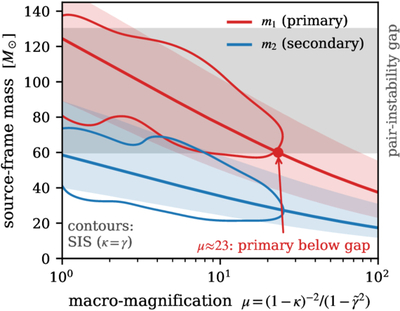
Caption: Figure B2.
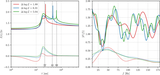
GW231123 source-frame component masses vs. total macro-magnification μ (embedded PL, NRSur). Lines and shaded bands show the median and 95% intervals as functions of μ, obtained from mass-sheet transformations; the gray region marks the pair-instability mass gap. Contours show the 95% c.l. 2D posteriors of (μ, m1,2) under the κ = γ (SIS) closure, which gives ﹩\mu =5.{0}_{-3.9}^{+12.0}﹩ (95% c.l.). The dot marks μ ≃ 23, where the median primary mass falls below the gap.
Other Images in This Article
Show More
Copyright and Terms & Conditions
© 2026. The Author(s). Published by the American Astronomical Society.

Copyright ©
2026 Astronomy Image Explorer. All Rights Reserved.
