

Image Details
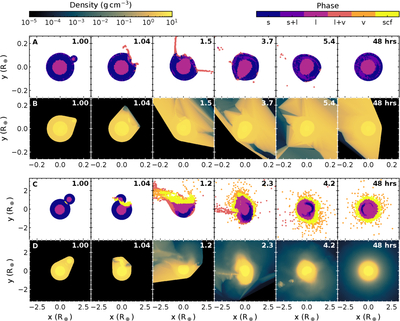
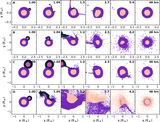
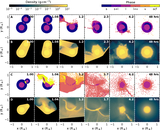
Caption: Figure 1.
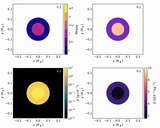
Progression of two example simulated collisions. Instantaneous phase (solid, mixed solid and liquid, liquid, mixed liquid and vapor, vapor, or supercritical fluid) and density in the midplane as two example collisions progress. The number in the upper right of each panel is the simulation time in hours. Phase panels show SPH particle positions, where white indicates no particles exist at that location. Density panels show the fluid representation using (3D) interpolation, and so density can be defined between particle positions; black areas are either at or below the minimum shown on the color scale, or indicate regions in which there are no particles that allow the density to be interpolated. Rows A and B: an accretion collision with a 10−3 M⊕ target, a mass ratio of 10−2 at 3vesc, and an impact angle of 30∘ (b = 0.5). Rows C and D: a mildly erosive collision with a 1 M⊕ target, a mass ratio of 0.1 at 5vesc, and an impact angle of 45∘ (b = 0.707). Note a different scale is used for each collision. Corresponding materials plots are shown in Figure A1.
Other Images in This Article
Show More
Copyright and Terms & Conditions
© 2026. The Author(s). Published by the American Astronomical Society.

