

Image Details
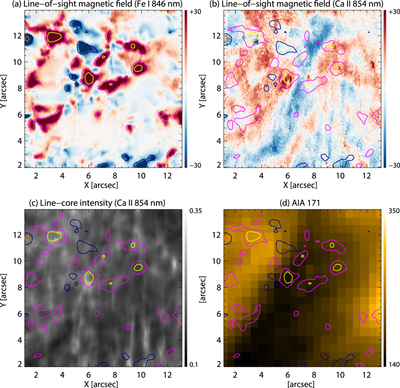
Caption: Figure 5.
ROI2: (a)–(b) LOS magnetic field for Fe I 846 nm and Ca II 854 nm. (c) Ca II 854 nm line-core intensity. (d) SDO/AIA 171 Å image (DN) at 06:09:45 UT. The magenta, navy, yellow, and orange contours indicate values of +20, −20, +100, and −100 G, respectively.
Other Images in This Article
Copyright and Terms & Conditions
© 2026. The Author(s). Published by the American Astronomical Society.

Copyright ©
2026 Astronomy Image Explorer. All Rights Reserved.
