

Image Details
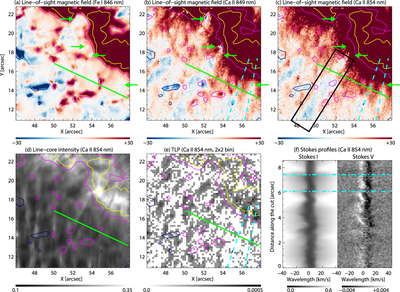
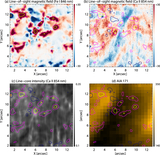
Caption: Figure 3.
ROI1: (a)–(c) LOS magnetic field from the weak-field approximation for Fe I 846 nm, Ca II 849 nm, and Ca II 854 nm. (d) Ca II 854 nm line-core intensity. (e) TLP of the Ca II 854 nm line (2 × 2 binning). (f) Wavelength-space maps along the green solid line (zero at the left end of the green solid line) for Stokes I (left) and Stokes V (right). The magenta, navy, and yellow contours indicate values of +20, −20, and +100 G, respectively. In the TLP map, pixels with values below 3σ of the continuum level are set to zero (white). The cyan dashed lines trace the weaker LOS magnetic field component of the canopy. The cyan dashed–dotted lines in panel (f) indicate the intersections between the green and cyan lines. The green arrows in panel (a) indicate weaker photospheric magnetic elements, some of opposite polarity, located just outside the network region. The black box in panel (c) highlights the particularly prominent opposite-polarity thread.
Other Images in This Article
Copyright and Terms & Conditions
© 2026. The Author(s). Published by the American Astronomical Society.

