

Image Details
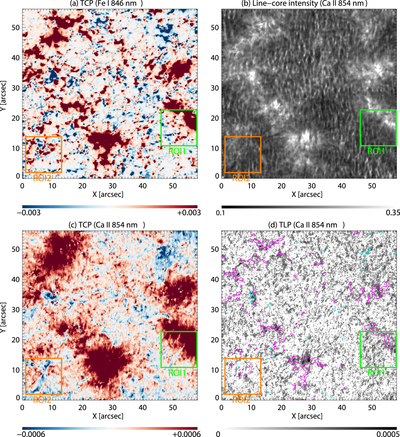
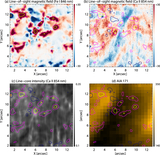
Caption: Figure 2.
SCIP raster-scan maps of (a) the total circular polarization (TCP) of the photospheric Fe I 846 nm line, (b) the line-core intensity of the chromospheric Ca II 854 nm line, (c) TCP of the Ca II 854 nm line, and (d) the total linear polarization (TLP) of the Ca II 854 nm line. The line-core intensities are normalized to the continuum intensity averaged over the entire FOV. The continuum intensity (Ic) is computed by averaging the spectral region from 850.6 to 850.7 nm. Definitions of TCP and TLP are provided in Appendix A.2. The TLP map is spatially binned by 2 × 2 pixels, and pixels with values below 3σ of the continuum level are set to zero (white). The magenta and cyan contours in panel (d) indicate TCP (Fe I 846 nm line) values of +0.01 Ic and −0.01 Ic, respectively. The green and orange boxes indicate the FOVs of Figures 3 (ROI1) and 5 (ROI2), respectively.
Other Images in This Article
Copyright and Terms & Conditions
© 2026. The Author(s). Published by the American Astronomical Society.

