

Image Details
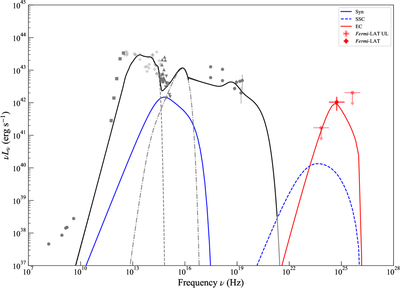
Caption: Figure 4.
Nonsimultaneous broadband spectral energy distribution of 1H 1934−063. The gray points show archival radio-to-X-ray measurements compiled from the literature and public catalogs (T. Nagao et al. 2001; R. M. Cutri et al. 2003; V. Beckmann et al. 2006; A. J. Bird et al. 2007; T. Mauch & E. M. Sadler 2007; S. Sazonov et al. 2007; B. M. Lasker et al. 2008; J. Rodriguez et al. 2008; A. Malizia et al. 2009; G. Cusumano et al. 2010; D. Ishihara et al. 2010; E. K. Mahony et al. 2010; H. I. Teplitz et al. 2010; M. J. Page et al. 2012; R. G. McMahon et al. 2013; M. Melendez et al. 2014; V. N. Yershov 2014; H. V. Abrahamyan et al. 2015; R. Boissay et al. 2016; A. A. Henden et al. 2016; M. Altmann et al. 2017; S. Chen et al. 2018; F. de Gasperin et al. 2018; Gaia Collaboration et al. 2018, 2021, 2023; K. G. Stassun et al. 2018; C. Wolf et al. 2018; K. Ichikawa et al. 2019; D. Asmus et al. 2020; E. A. Magnier et al. 2020; T. M. O. Franzen et al. 2021; Y. A. Gordon et al. 2021; S. W. Duchesne et al. 2025; W. J. Hon et al. 2025). The red symbols denote the Fermi-LAT detections and 95% upper limits during the flare interval. The blue solid, blue dashed, and red solid curves show representative synchrotron, synchrotron self-Compton (SSC), and external Compton (EC) components, respectively, while the black curve represents the phenomenological thermal contribution. The model curves are intended as an illustrative broadband representation rather than a unique physical fit.
Other Images in This Article
Copyright and Terms & Conditions
© 2026. The Author(s). Published by the American Astronomical Society.

