

Image Details
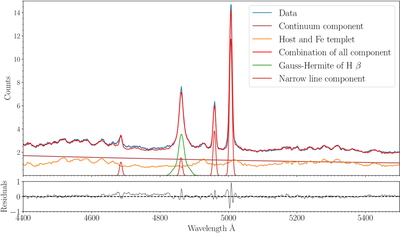
Caption: Figure 3.
Spectral decomposition of the 6dFGS Hβ–[O III] region for 1H 1934−063. The upper panel shows the observed counts spectrum (blue), the continuum component, the host-galaxy and Fe template, the narrow-line component, the Gauss–Hermite model for the broad Hβ component, and the total best-fit model. The lower panel shows the residuals of the fit. The decomposition indicates that the narrow-line contribution is nonnegligible, while the broad Hβ profile is better described by a Gauss–Hermite function than by a single Lorentzian.
Other Images in This Article
Copyright and Terms & Conditions
© 2026. The Author(s). Published by the American Astronomical Society.

Copyright ©
2026 Astronomy Image Explorer. All Rights Reserved.
