

Image Details
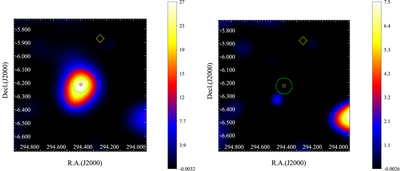
Caption: Figure 2.
TS map (left) and residual map (right) in the 1–500 GeV band for the flare interval MJD 58788–59031. The green circle shows the 95% statistical localization region centered on the best-fit γ-ray position of the excess. The red cross and green box indicate the optical and radio positions of 1H 1934–063, respectively, while the yellow diamond marks the nearby source FL16Y J1936.9–0552.
Other Images in This Article
Copyright and Terms & Conditions
© 2026. The Author(s). Published by the American Astronomical Society.

Copyright ©
2026 Astronomy Image Explorer. All Rights Reserved.
