

Image Details
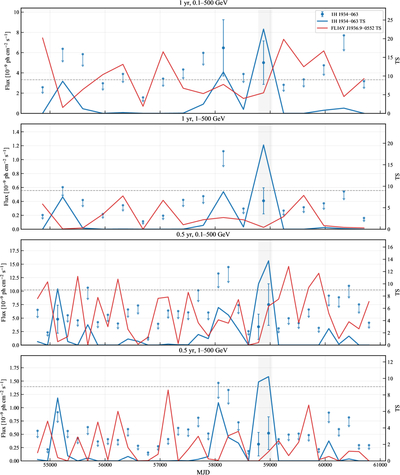
Caption: Figure 1.
Fermi-LAT light curves of 1H 1934–063 obtained with the FL16Y source model. The panels compare different energy ranges and temporal binnings, as labeled. Blue points and arrows denote the photon fluxes and 95% upper limits of 1H 1934–063, while the blue and red curves show the TS values of 1H 1934–063 and FL16Y J1936.9–0552, respectively. Upper limits are shown for bins with TS < 9. The dashed line marks TS = 9, and the gray shaded region indicates the flare interval MJD 58788–59031.
Other Images in This Article
Copyright and Terms & Conditions
© 2026. The Author(s). Published by the American Astronomical Society.

Copyright ©
2026 Astronomy Image Explorer. All Rights Reserved.
