

Image Details
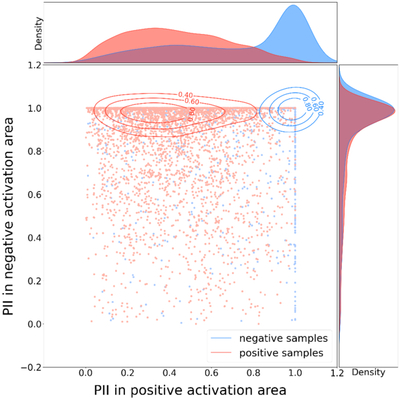
Caption: Figure 6.
The joint (center) and univariate (top and right) distributions of the Polarity Imbalance Index in positive and negative activation areas across different solar active regions. Each dot represents an active-region event. The contours represent probability density: red indicates a positive sample and blue indicates a negative sample. The contours are darker or lighter depending on the percentage value.
Other Images in This Article
Copyright and Terms & Conditions
© 2026. The Author(s). Published by the American Astronomical Society.

Copyright ©
2026 Astronomy Image Explorer. All Rights Reserved.
