

Image Details
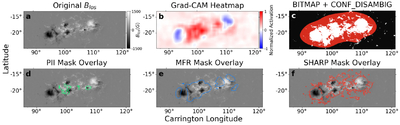
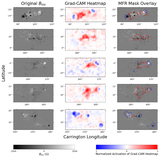
Caption: Figure 3.
An example (HARP 5983 on 2015 September 30 at 03:00:00 UT) illustrating different mask types used in the analysis. (a) The line-of-sight magnetogram. (b) The Grad-CAM heatmap. (c) The overlapping region where BITMAP ≥ 30 (red) and CONF_DISAMBIG ≥ 70 (white). (d) The PIL mask contours (green). (e) The MFR mask contours (blue). (f) The SHARP mask contours (red).
Other Images in This Article
Copyright and Terms & Conditions
© 2026. The Author(s). Published by the American Astronomical Society.

Copyright ©
2026 Astronomy Image Explorer. All Rights Reserved.
