

Image Details
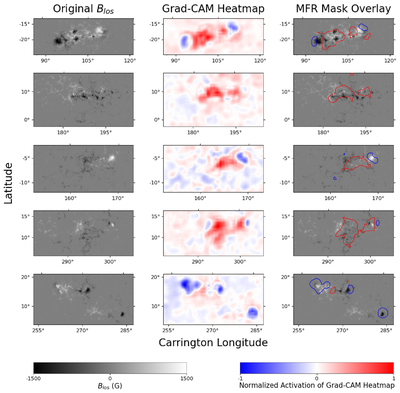
Caption: Figure 5.
Examples of active regions. (a) HARP 5983 on 2015 September 30 at 03:00:00 TAI. (b) HARP 2693 on 2013 May 2 at 08:00:00 TAI. (c) HARP 6167 on 2015 December 10 at 20:00:00 TAI. (d) HARP 2748 on 2013 May 22 at 08:00:00 TAI. (e) HARP 504 on 2011 April 16 at 08:00:00 TAI. From left to right: magnetogram (Blos), Grad-CAM heatmap (normalized), and MFR mask contour with red (positive) and blue (negative) activations.
Other Images in This Article
Copyright and Terms & Conditions
© 2026. The Author(s). Published by the American Astronomical Society.

Copyright ©
2026 Astronomy Image Explorer. All Rights Reserved.
