

Image Details
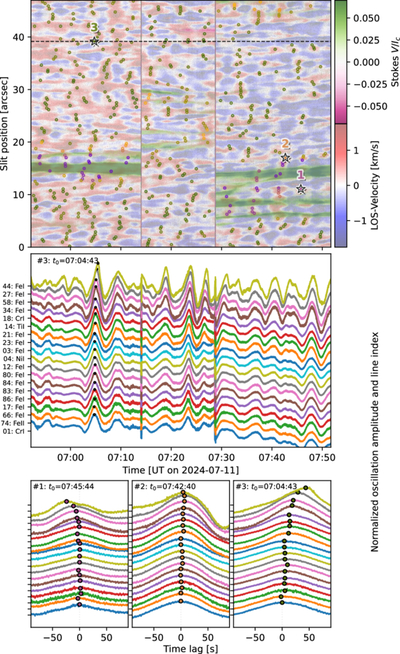
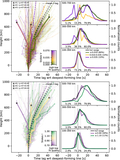
Caption: Figure 4.
Line-core oscillation maps and line plots. Top panel: slit-time map for the deepest forming spectral line (Cr I 395.839 nm). The blue-red color coding marks the amplitude of the line-core LoS-velocity oscillation. The green and purple overlay indicates the Stokes V signal of positive and negative polarity, respectively. The velocity peak locations are marked by dots (N = 502). An animation showing the maps for all other spectral lines is available. The animation starts at h = 14.6 km and ends at h = 797.1 km. At the top of then animation, the line number, line identifier, and h value is provided. The real-time duration of the animation is 6 s. Middle panel: horizontal cut through top panel (dashed line), containing the location (3) at (y = 39″, t0 = 07:04:43), showing the line-core oscillations for all 19 spectral lines. Bottom panel: zoom in on locations (1), (2), and (3), labeled in the top panel, and exemplifying the three t-lag categories for the propagation of wave pulses in the solar atmosphere: downward propagation (left, t-lag category 1), zero propagation (middle, t-lag category 2), and upward propagation (right, t-lag category 3).
(An animation of this figure is available in the online article.)
(An animation of this figure is available.)
The video/animation of this figure is available in the online journal.
Other Images in This Article
Copyright and Terms & Conditions
© 2026. The Author(s). Published by the American Astronomical Society.

