

Image Details
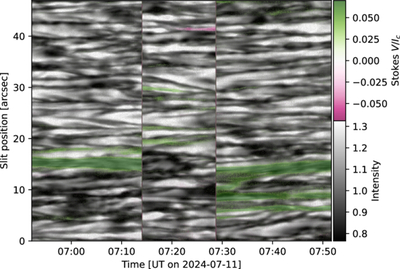
Caption: Figure 2.
Observed SUSI continuum intensity (Ic) time–distance map (grayscale). The sit-and-stare observation reveals the temporal evolution of the granules. The discontinuities correspond to pointing adjustments during the 1 hr long observation. The green-purple colored overlay shows the Stokes V/Ic polarization map, accumulated over all spectral lines used in the study.
Other Images in This Article
Copyright and Terms & Conditions
© 2026. The Author(s). Published by the American Astronomical Society.

Copyright ©
2026 Astronomy Image Explorer. All Rights Reserved.
