

Image Details
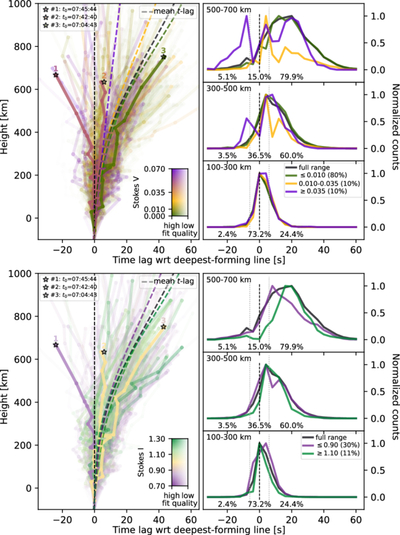
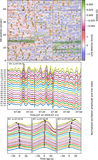
Caption: Figure 5.
Height dependence of time lags for all 502 traced pulses with respect to the peak position of the deepest forming spectral line (t0). Upper left panel: the individual lines connect the time lags of a single pulse measured at the line-core formation heights of all spectral lines computed from the best-matching MHD atmosphere. The three examples shown in the bottom panel of Figure 4 are highlighted with increased opacity, with their highest point marked with a star. Upper right panel: histograms of time lags for three different height ranges. Bottom: same as the top panel, but now with the continuum intensity as the color-shading agent.
Other Images in This Article
Copyright and Terms & Conditions
© 2026. The Author(s). Published by the American Astronomical Society.

