

Image Details
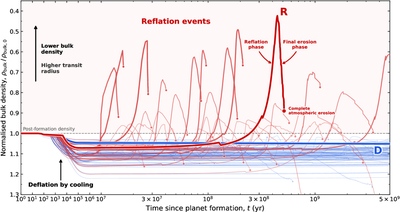
Caption: Figure 1.
Reflation events (red) occur across a range of ages and with different magnitudes across the evolution of irradiated super-Earths. The plot shows the normalized bulk-density evolution of individual simulations, vs. the time elapsed since planet formation. The red lines indicate cases where a reflation event occurs, while blue lines indicate those where it does not occur. The evolution tracks that end with a dot indicate the planet has reached an airless state and complete atmospheric erosion by hydrodynamic escape has taken place. The evolution of the two select cases for Figure 1 are highlighted and denoted with an R and a D. These illustrate in more detail representative reflation (red) and deflation cases (blue).
Other Images in This Article
Copyright and Terms & Conditions
© 2026. The Author(s). Published by the American Astronomical Society.

