

Image Details
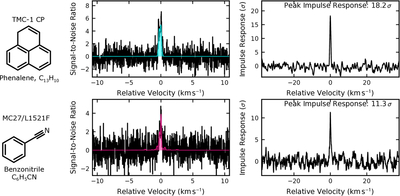
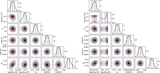
Caption: Figure A1.
(Top left) Velocity-stacked spectra of the simulated phenalene emission (aqua) and observational data (black) and (top right) matched filter response of phenalene in the GOTHAM data toward TMC-1 CP. (Bottom left) Velocity-stacked spectra of the simulated benzonitrile emission (magenta) and observational data (black) and (bottom right) matched filter response of benzonitrile in the ARKHAM data toward MC27/L1521F. All plots were generated using the methodologies outlined in R. A. Loomis et al. (2021).
Other Images in This Article
Copyright and Terms & Conditions
© 2026. The Author(s). Published by the American Astronomical Society.

Copyright ©
2026 Astronomy Image Explorer. All Rights Reserved.
