

Image Details
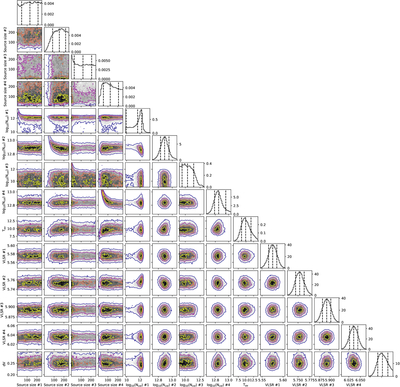
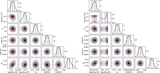
Caption: Figure A2.
Parameter covariances and marginalized posterior distributions for the MCMC fit of phenalene in TMC-1 CP. The 16th, 50th, and 84th confidence intervals (corresponding to ±1σ for a Gaussian posterior distribution) are depicted as vertical lines on the diagonal plots.
Other Images in This Article
Copyright and Terms & Conditions
© 2026. The Author(s). Published by the American Astronomical Society.

Copyright ©
2026 Astronomy Image Explorer. All Rights Reserved.
