

Image Details
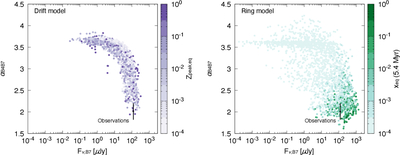
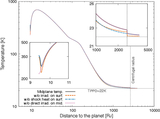
Caption: Figure 5.
Same as Figure 3, but with colors representing different quantities. The colors in the left and right panels represent the peak dust-to-gas surface density ratio in the Drift model, Zpeak,eq, and the equivalent dust-to-gas inflow mass ratio in the Ring model, xeq, respectively. The latter is calculated by equating the total dust mass in the CPD with the dust mass that would be supplied over 5.4 Myr for xeq.
Other Images in This Article
Copyright and Terms & Conditions
© 2026. The Author(s). Published by the American Astronomical Society.

Copyright ©
2026 Astronomy Image Explorer. All Rights Reserved.
