

Image Details
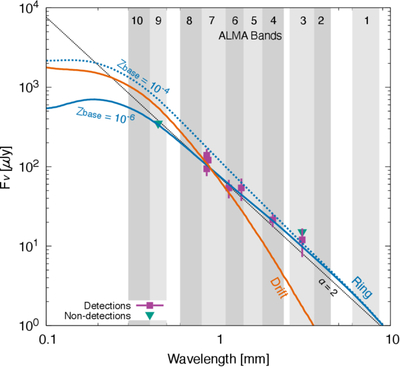
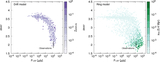
Caption: Figure 1.
Flux density of the continuum emission from PDS 70 c obtained from multiwavelength ALMA observations, together with model predictions for the dust thermal emission from the CPD in the Drift and Ring models. The squares and inverted triangles indicate detections and nondetections listed in Table 1. For the Ring model, the solid and dotted curves indicate Zbase = 10−6 and 10−4, respectively. The dotted line represents α = 2. The shaded bands represent the wavelength ranges of ALMA bands.
Other Images in This Article
Copyright and Terms & Conditions
© 2026. The Author(s). Published by the American Astronomical Society.

Copyright ©
2026 Astronomy Image Explorer. All Rights Reserved.
