

Image Details
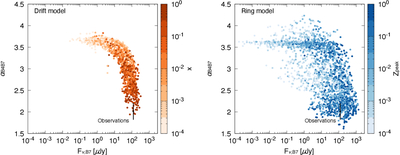
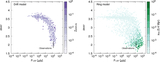
Caption: Figure 3.
Comparisons of the predictions by the Drift model (left panel) and Ring model (right panel) with ALMA observations of PDS 70 c. The parameter ranges of the models are shown in the “Broad-parameter cases” column in Table 2. The large cross represents the disk-integrated flux density in ALMA Band 7 (Fν,B7 = 121 ± 13 μJy) and the disk-integrated spectral index of Bands 4 and 7 (αB4,B7 = 2.01 ± 0.19) observed by O. Domínguez-Jamett et al. (2025). The colors in the left and right panels represent the dust-to-gas mass ratio in the gas flow, x, and the dust-to-gas surface density ratio at the peak, Zpeak, respectively.
Other Images in This Article
Copyright and Terms & Conditions
© 2026. The Author(s). Published by the American Astronomical Society.

