

Image Details
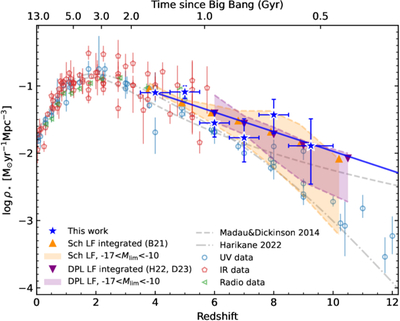
Caption: Figure 2.
Cosmic star formation history. The blue stars represent our estimates from Swift LGRBs, with the blue solid line showing the log-linear fit to these points (k = −0.15). The orange shaded region shows the result of integrating the Schechter LFs of R. J. Bouwens et al. (2021) adopting the limits from ﹩{M}_{{\rm{lim}}}=-17﹩ to −10, while the purple shaded region shows that from the DPL fits (Y. Harikane et al. 2022; C. T. Donnan et al. 2023). In particular, the orange up triangles denote the results for the Schechter model down to ﹩{M}_{{\rm{lim}}}﹩ = −17, −15, −14, −13, −13, −12, −10 for ﹩\left\langle z\right\rangle =3.8﹩, 4.9, 5.9, 6.8, 7.9, 8.9, 10.2, respectively. The purple down triangles denote the results for the DPL models with ﹩{M}_{{\rm{lim}}}=-15,\,-14,\,-12,\,-11,\,-11﹩ for ﹩\left\langle z\right\rangle =6﹩, 7, 8, 9, 10.5, respectively. The gray dashed and dotted–dashed lines denote the empirical fits from P. Madau & M. Dickinson (2014) and Y. Harikane et al. (2022), respectively. The open circles, pentagons, and left triangles represent observations determined from the UV data (P. Madau & M. Dickinson 2014; S. L. Finkelstein et al. 2015; R. Bhatawdekar et al. 2019; R. Bouwens et al. 2020; Y. Harikane et al. 2023; C. T. Donnan et al. 2024; C. J. Willott et al. 2024), IR/(sub)millimeter data (P. Madau & M. Dickinson 2014; M. Rowan-Robinson et al. 2016; D. Liu et al. 2018; C. Gruppioni et al. 2020; A. Traina et al. 2024, 2026), and radio data (M. Novak et al. 2017), respectively. All UV values shown here are determined using a limit of ﹩{M}_{{\rm{lim}}}=17﹩, with the only exception of R. Bhatawdekar et al. (2019) using ﹩{M}_{{\rm{lim}}}=13.5﹩. All results have been converted to the Salpeter IMF if necessary.
Other Images in This Article
Copyright and Terms & Conditions
© 2026. The Author(s). Published by the American Astronomical Society.

