

Image Details
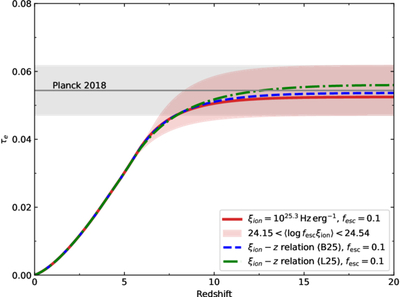
Caption: Figure 4.
Predictions of the Thomson scattering optical depth. The gray line and region represent the measurement provided by Planck, i.e., τe = 0.0544 ± 0.0073. The red solid, blue dashed, and green dotted–dashed lines correspond to the results shown in Figure 3. The red shaded region represents the values of ﹩24.15\lt \langle \mathrm{log}{f}_{{\rm{esc}}}{\xi }_{{\rm{ion}}}\rangle \lt 24.54﹩ constrained by the measured errors.
Other Images in This Article
Copyright and Terms & Conditions
© 2026. The Author(s). Published by the American Astronomical Society.

Copyright ©
2026 Astronomy Image Explorer. All Rights Reserved.
