

Image Details
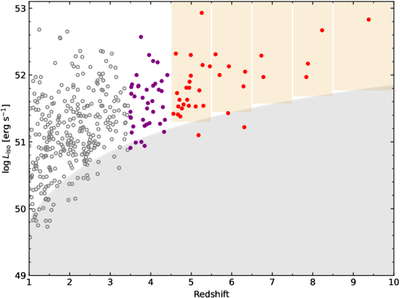
Caption: Figure 1.
The luminosity-redshift distribution of Swift LGRBs. The gray shaded region represents an approximate luminosity threshold for detection. The purple circles are the 39 LGRBs at 3.5 ≤ z < 4.5 used as our benchmark. The 36 bursts at z ≥ 4.5 are separated into different redshift bins (orange shaded bands) used to estimate the high-redshift SFRD.
Other Images in This Article
Copyright and Terms & Conditions
© 2026. The Author(s). Published by the American Astronomical Society.

Copyright ©
2026 Astronomy Image Explorer. All Rights Reserved.
