

Image Details
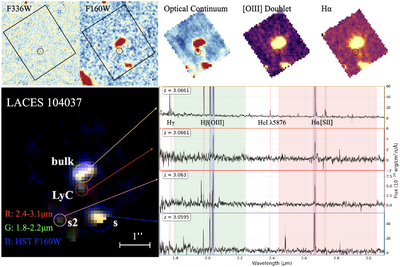
Caption: Figure 1.
HST and JWST observations of LACES104037. TOP panels: HST/WFC3 imaging obtained by the LACES program (HST-GO-14747, PI: Robertson, T. J. Fletcher et al. 2019) and NIRSpec/IFU maps from the G235M/F170LP observations acquired by JWST-GO-1827 (PI: Kakiichi). From left to right, we show the LyC band (F336W), the near-UV continuum (F160W), the optical continuum reconstructed from the IFU observations (with emission features masked), and the flux maps of [O III] and Hα. The black box marks the IFU FoV, while the black circle with a radius of 0﹩\mathop{.}\limits^{{\unicode{x02033}}}﹩2 indicates the region of significant LyC leakage. The IFU maps are trimmed at the edges to exclude regions strongly affected by instrumental artifacts. Bottom panels: three-color composite image and optimally extracted 1D spectra for the bulk of the system (LACES104037-bulk), the LyC-leaking region (LACES104037-LyC), and two mergers (LACES104037s and LACES104037s2), all spectroscopically confirmed at z = 3.06. The green and red shaded regions indicate the wavelength ranges corresponding to two of the color channels in the composite image, while the blue shaded region marks the wavelength coverage of the [O III] and Hα emission-line maps.
Other Images in This Article
Copyright and Terms & Conditions
© 2026. The Author(s). Published by the American Astronomical Society.

