

Image Details
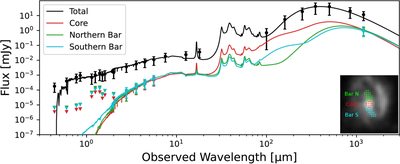
Caption: Figure 6.
Spectral energy distribution model of GN20. The best-fit SED model from MAGPHYS with the total, core, northern bar, and southern bar are shown in the black, red, green, and cyan curves, respectively. The inset shows the regions on a 2″ × 2″ NIRCam/F444W cutout.
Other Images in This Article
Copyright and Terms & Conditions
© 2026. The Author(s). Published by the American Astronomical Society.

Copyright ©
2026 Astronomy Image Explorer. All Rights Reserved.
