

Image Details
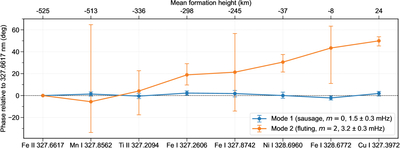
Caption: Figure 3.
Consensus phase behavior of the two dominant recovered POD modes across the selected spectral lines. The phase is measured relative to the lowest-forming selected line, Fe II 327.6617 nm, and is shown for the frequency bands in which the common coherence is strongest: 1.5 ± 0.3 mHz for the sausage mode and 3.2 ± 0.3 mHz for the fluting mode. Only phase values from regions outside the cone of influence and above the 95% coherence significance threshold are retained. The plotted phase at each spectral line is the coherence-weighted mean phase, and the error bars denote the corresponding 16th–84th percentile-based phase spread. The lower horizontal axis lists the spectral lines, while the upper axis gives their adopted mean formation heights. The sausage mode remains close to zero phase difference across the sampled heights, consistent with standing or near-standing behavior, whereas the fluting mode shows a modest but systematic increase in phase with height, indicative of an upward-propagating component.
Other Images in This Article
Copyright and Terms & Conditions
© 2026. The Author(s). Published by the American Astronomical Society.

