

Image Details
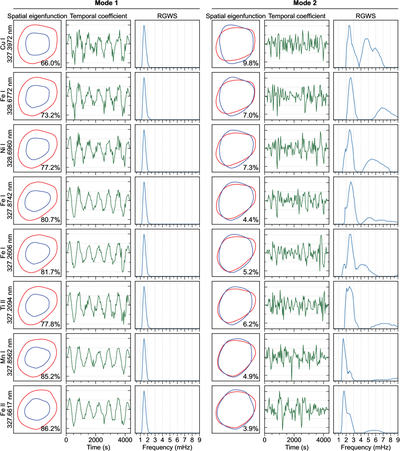
Caption: Figure 2.
Two dominant recovered POD modes identified from the pore-boundary oscillations in the eight selected spectral lines, ordered by increasing formation height from bottom to top. For each line, the first three columns show the first recovered POD mode and the last three columns the second recovered POD mode. Within each group, the panels show the spatial eigenfunction, the corresponding temporal coefficient, and the refined global wavelet spectrum (RGWS). The temporal coefficient panels are plotted on the same vertical scale within each mode to allow a direct comparison of amplitudes between spectral lines. The percentages quoted in the spatial panels indicate the normalized eigenvalue fraction of each mode, that is, the corresponding eigenvalue divided by the sum of all eigenvalues. The first mode is consistently sausage-like and dominates the total normalized eigenvalue fraction, while the second mode is consistently fluting-like with m = 2 and contributes a smaller but still coherent fraction.
(An animation of this figure is available in the online article.)
(An animation of this figure is available.)
The video/animation of this figure is available in the online journal.
Other Images in This Article
Copyright and Terms & Conditions
© 2026. The Author(s). Published by the American Astronomical Society.

