

Image Details
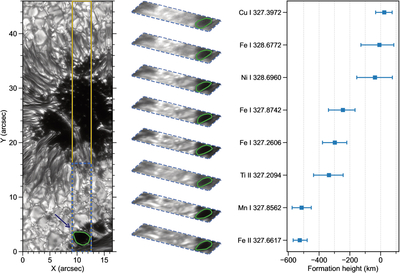
Caption: Figure 1.
Observational context and selected spectral lines used in the present analysis. The left panel shows a SUSI slit-jaw image near the continuum. The yellow lines mark the full raster field of view, while the dashed blue rectangle marks the smaller portion of that field shown in the middle panel. The arrow and green contour indicate the pore analyzed in this work. The middle panel presents representative line-core intensity raster images for the eight selected spectral lines, displayed as a three-dimensional stack and ordered by increasing effective formation height. The dashed blue outlines mark the boundaries of the displayed raster cutouts, and the green contours indicate the pore boundaries overplotted at each sampled height. The right panel shows the adopted formation heights of the same lines. Symbols indicate the weighted-mean CF heights, and the error bars denote the 16th–84th percentile range, illustrating the finite vertical extent sampled by each line. These heights are used here primarily as approximate proxies for relative ordering rather than as precise geometrical heights. Most heights are negative because of the Wilson depression.
Other Images in This Article
Copyright and Terms & Conditions
© 2026. The Author(s). Published by the American Astronomical Society.

