

Image Details
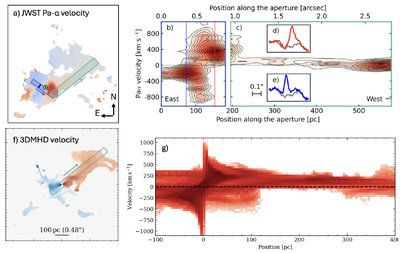
Caption: Figure 3.
PV diagrams. (a) v50 map with slit positions and extraction directions (green circle marks AGN position from A. C. Fabian et al. 2016). (b) PV diagram along the blue slit (CND), showing velocities rapidly declining to systemic on both sides. (c) PV diagram along the green slit, highlighting the filament’s kinematic connection to the CND. Velocities are relative to systemic (dashed horizontal line); contours start at 3σ and increase by 1σ. The scale bar shows the NIRSpec/IFU spatial resolution. (d)–(e) Example Paα spectra from the receding (red) and approaching (blue) sides, extracted from the regions and positions marked in (a) and (b). The continuum is shown with the gray curves. (f) Snapshot of 3D MHD simulated velocity field within an NIRSpec/IFU FOV, same as in Figure 2 with slit position shown with the green rectangle. (g) PV diagram along the green slit, highlighting the filament’s kinematic connection to the 3D MHD CND.
Other Images in This Article
Copyright and Terms & Conditions
© 2026. The Author(s). Published by the American Astronomical Society.

