

Image Details
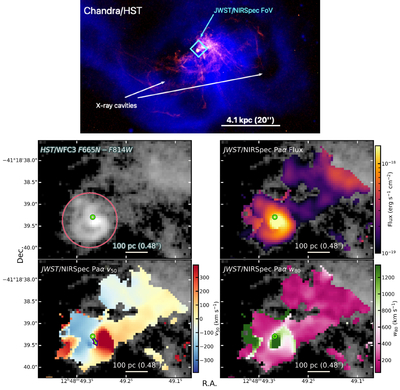
Caption: Figure 1.
Top panel: composite large-scale image of the Centaurus cluster. Chandra 0.5–7 keV image in blue. Hubble Space Telescope (HST)/WFC3 F665N (containing redshifted Hα), with the continuum estimated from F814W and subtracted, shown in red. The field of view (FOV) of James Webb Space Telescope (JWST) Near-Infrared Spectrograph (NIRspec) is shown with the cyan square. Middle and bottom panels: the central 760 × 550 pc of NGC 4696. Top left: HST/WFC3 F665N (containing redshifted Hα), with the continuum estimated from F814W and subtracted, revealing the S-shaped ionized swirl. The approximate edge of the assumed circumnuclear disk (CND) is shown in a red circle. Top right: same image in gray scale but with Paα flux map (NIRSpec) overlaid. Bottom left and right: same with v50 (centroid velocity) and w80 (80% line width) maps, respectively, derived from the NIRSpec cube (Section 2). We see a CND connected to a filamentary structure to the west. The AGN position (A. C. Fabian et al. 2016) is marked (green circle), with the arrow in v50 indicating the Very Long Baseline Array (VLBA) jet direction (G. B. Taylor et al. 2006); velocities are relative to the systemic of NGC 4696.
Other Images in This Article
Copyright and Terms & Conditions
© 2026. The Author(s). Published by the American Astronomical Society.

