

Image Details
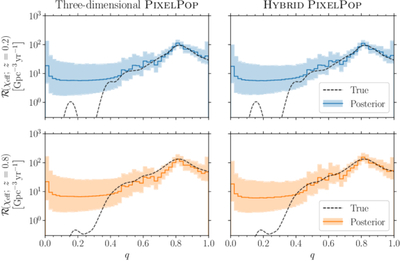
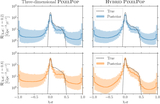
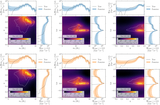
Caption: Figure 14.
Inferred marginalized merger-rate density ﹩{ \mathcal R }(q;z)﹩ at redshifts z = 0.2 (blue) and z = 0.8 (orange) for the three-dimensional PIXELPOP (left) and HYBRID (right) models, using the catalog of point-estimate events. The dashed line represents the true population, while the solid line and shaded region represent the posterior median and central 90% credible region. There are no deviations between the inferred and true rates in the 0.5 ≲ q ≲ 0.7 region.
Other Images in This Article
Show More
Copyright and Terms & Conditions
© 2026. The Author(s). Published by the American Astronomical Society.

Copyright ©
2026 Astronomy Image Explorer. All Rights Reserved.
