

Image Details
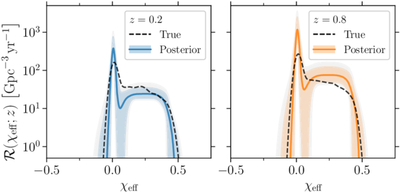
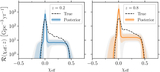
Caption: Figure 11.
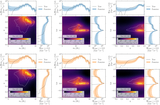
Inferred merger-rate density ﹩{ \mathcal R }({\chi }_{{\rm{eff}}};z)﹩ at redshifts z = 0.2 (left, in blue) and z = 0.8 (right, in orange) with the PEAK + TUKEY model on the population with artificially removed correlations. Compared to Figure 4, the true distribution (dashed lines) is now within the 99% credible interval (shaded gray region) of the inferred rate.
Other Images in This Article
Show More
Copyright and Terms & Conditions
© 2026. The Author(s). Published by the American Astronomical Society.

Copyright ©
2026 Astronomy Image Explorer. All Rights Reserved.
